Exploring the Cost of College Tuition
All models are wrong, but some are useful.- George Box
Contributors: Shonda Kuiper, Joyce Gill, Khanh Do

Part 1: A Simple Regression Model to Estimate the Cost of Tuition
One of the most important decisions high school students face is deciding what to do after graduation. If they choose to further their education, how can they know which college or university is best for them? Along with questions about academic programs, campus life, and location comes another important question: Why do some colleges cost so much more than others?
One way to begin answering this question is to examine the relationships between tuition costs and the characteristics of colleges and universities. Figure 1 examines one such relationship by comparing out-of-state tuition costs at public universities with the Bachelor's Rate, the percentage of students who earn a bachelor's degree within six years.
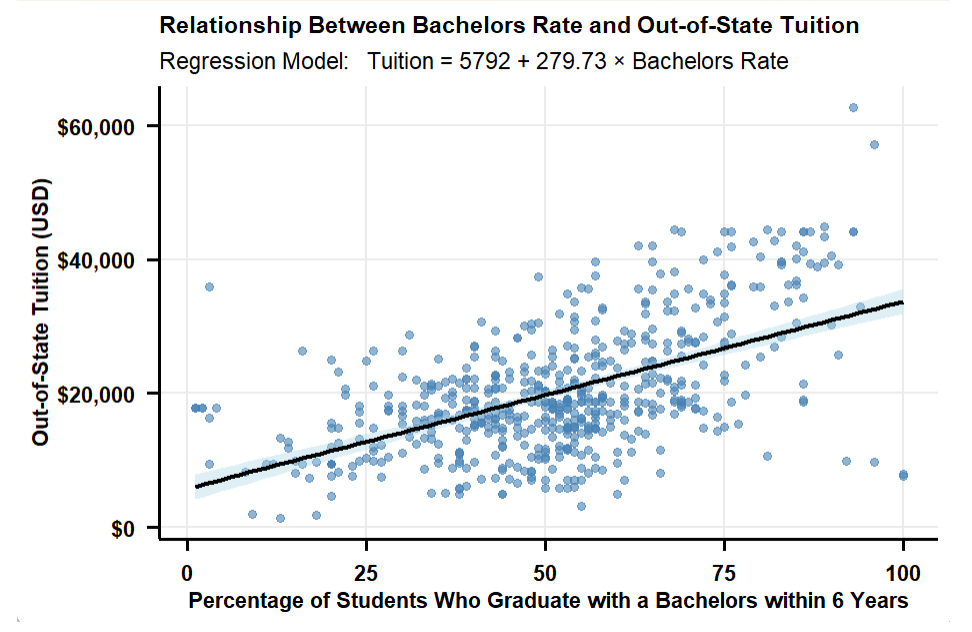
The scatterplot shows that schools with higher tuition tend to have higher graduation rates. The regression model estimates that for every one-percentage-point increase in bachelor's rate, the expected tuition cost increases by approximately $279.73.
In addition, the p-value associated with the slope is small (p < 0.01), indicating there is a meaningful pattern in the data. In other words, schools with higher graduation rates tend to charge higher tuition.
Although the bachelor's rate helps explain some variation in tuition, it clearly does not tell the whole story. Many schools fall well above or below the regression line, meaning their tuition costs are much higher or lower than would be expected.
The Tuition Visualization App below makes it easy to identify schools and compare their actual versus their expected tuition. For example, try searching for schools containing the word "Iowa." Among Iowa's three public universities, two have tuition costs that are higher than expected based on their graduation rates, while one has tuition costs that are lower than expected.
A description of each of the variables in the App is provided here:
Part 2: Building Multiple Regression Models
A single variable rarely tells the whole story.
To create a more accurate estimate of data such as this example with tuition costs, statisticians and data scientists create multiple regression models. This means they create regression models with two or more explanatory variables. Use of additional variables may make this model more accurate and thus better explain why some colleges are more expensive than others.
To measure the accuracy of a model, researchers use an R2 statistic. When R2 = 1, the model is perfectly accurate; in other words, all observations fit exactly on the regression line. When R2 = 0, the model explains none of the variability in tuition costs.
It’s tempting to start experimenting, changing multiple combinations of variables until you get an accurate model (i.e. a high R2 value). In fact, there are numerous software algorithms designed to do just that. But there is a problem: as researchers experiment with many combinations of variables trying to get an accurate model, the p-values for each coefficient are no longer reliable.
To see an example of this, we can dramatically improve the R2 value in the tuition app by creating a multiple regression model using the following explanatory variables:
- 6 Year Bachelors Rate
- Graduation Rate (men)
- Total Grant Aid
Part 3: Contradictory Results?
In Part 1, we found strong evidence that public universities with higher six-year bachelor's graduation rates tend to have higher out-of-state tuition costs. The relationship appeared clear, and the p-value was extremely small.
But after adding just two additional explanatory variables, the relationship reverses. Instead of showing an increasing relationship between graduation rates and tuition, the multiple regression model provides “statistically significant” evidence of a decreasing relationship.
How can the same data lead to two seemingly contradictory conclusions?
The answer highlights one of the most common errors in regression analysis: the goals of the analysis should influence the type of analysis conducted.
If the goal is to build the most accurate model, then it makes sense to compare many different models and evaluate how well each combination of variables performs using measures such as the R² value.
However, if the goal is to test the significance of particular variables, such as "Do public universities with higher graduation rates tend to charge higher tuition?" then interpreting regression coefficients and p-values becomes much more challenging. Trying many different combinations of variables and looking for small p-values can lead to misleading conclusions. A small p-value may appear convincing, but it does not necessarily provide strong evidence that a variable has an important or meaningful relationship with the response.
Two common challenges make the interpretation of multiple regression models particularly difficult.
- Correlated explanatory variables: Multicollinearity is a condition in regression analysis where two or more explanatory variables contain overlapping or redundant information about the response variable. When this happens, the model often cannot distinguish the individual contribution of each predictor, because changes in one variable tend to be associated with changes in another. As a result, the estimated regression coefficients can become unstable, sometimes changing dramatically when a new variable is added or removed from the model.1
- Multiple comparisons (often called p-hacking): Even if none of the variables truly affect tuition in a meaningful way, random noise can produce “statistically significant” results if you try enough combinations. When creating multivariate models, researchers often try numerous models to find the combination of explanatory variables that provides the most accurate model. Exploring data is an important part of statistical analysis, and there is nothing wrong with looking for interesting patterns. The challenge is that once extensive exploration has occurred, p-values no longer have the straightforward interpretation that many people assume they do.
Many people view a p-value as the final answer to a research question. It is only one piece of evidence. A p-value cannot tell us whether a hypothesis is true, how important a relationship is, or whether the result will appear again in future studies.
Even a simple research question requires many choices that can shape the results. In addition to selecting variables, researchers can influence how the data was collected, the type of analysis to use, how missing values and outliers were handled, and whether the assumptions of the analysis were reasonable. Each choice may be reasonable on its own, but they can result in very different conclusions.
The next time you encounter a statistical claim, don't stop at the p-value. Ask questions. Examine the data. Consider the assumptions. Most importantly, look for evidence that the result can be reproduced. When findings remain consistent across multiple studies, datasets, and methods, we can begin to have confidence that we are uncovering a genuine pattern rather than a statistical illusion.
Part 4: Next Steps
You can find an app that allows you to conduct a much more thorough investigation of modeling tuition costs here: Open app
You can find additional questions and a more detailed analysis here.
1 There are ways to address correlated explanatory variables in regression models, such as calculating the variance inflation factor.
Dataspace is supported by the Grinnell College Innovation Fund and was developed by Grinnell College faculty and students. Copyright © 2021. All rights reserved
This page was last updated on March 19, 2025.